
These three tech giants have all gained more than 20% in a single day so far in 2025. They are all at least friendly with President Donald Trump, who sees them as supporting U.S. national security long term. And, they are all dot-com bubble survivors. There’s only one problem here in early November.
These 3 Tech Icons Have Charts That Scream ‘Danger’
That doesn’t mean they will immediately plunge in price, or that they will even have more than a “buy the dip” event any time soon. What it does mean, based on my read of their stock charts over multiple time frames, is that they are very vulnerable.
So vulnerable, that amongst literally hundreds of stocks within the S&P 500 Index ($SPX) that look weak or worse, I chose to focus on this trio here. So, which stocks am I talking about?
The first is Intel (INTC), which on Sept. 18 announced a $5 billion investment from Nvidia (NVDA). That followed news in August in which the U.S. government made a rare decision to convert previously awarded grants into cold hard equity. That makes Uncle Sam a 10% stakeholder in the now-mature semiconductor stock.
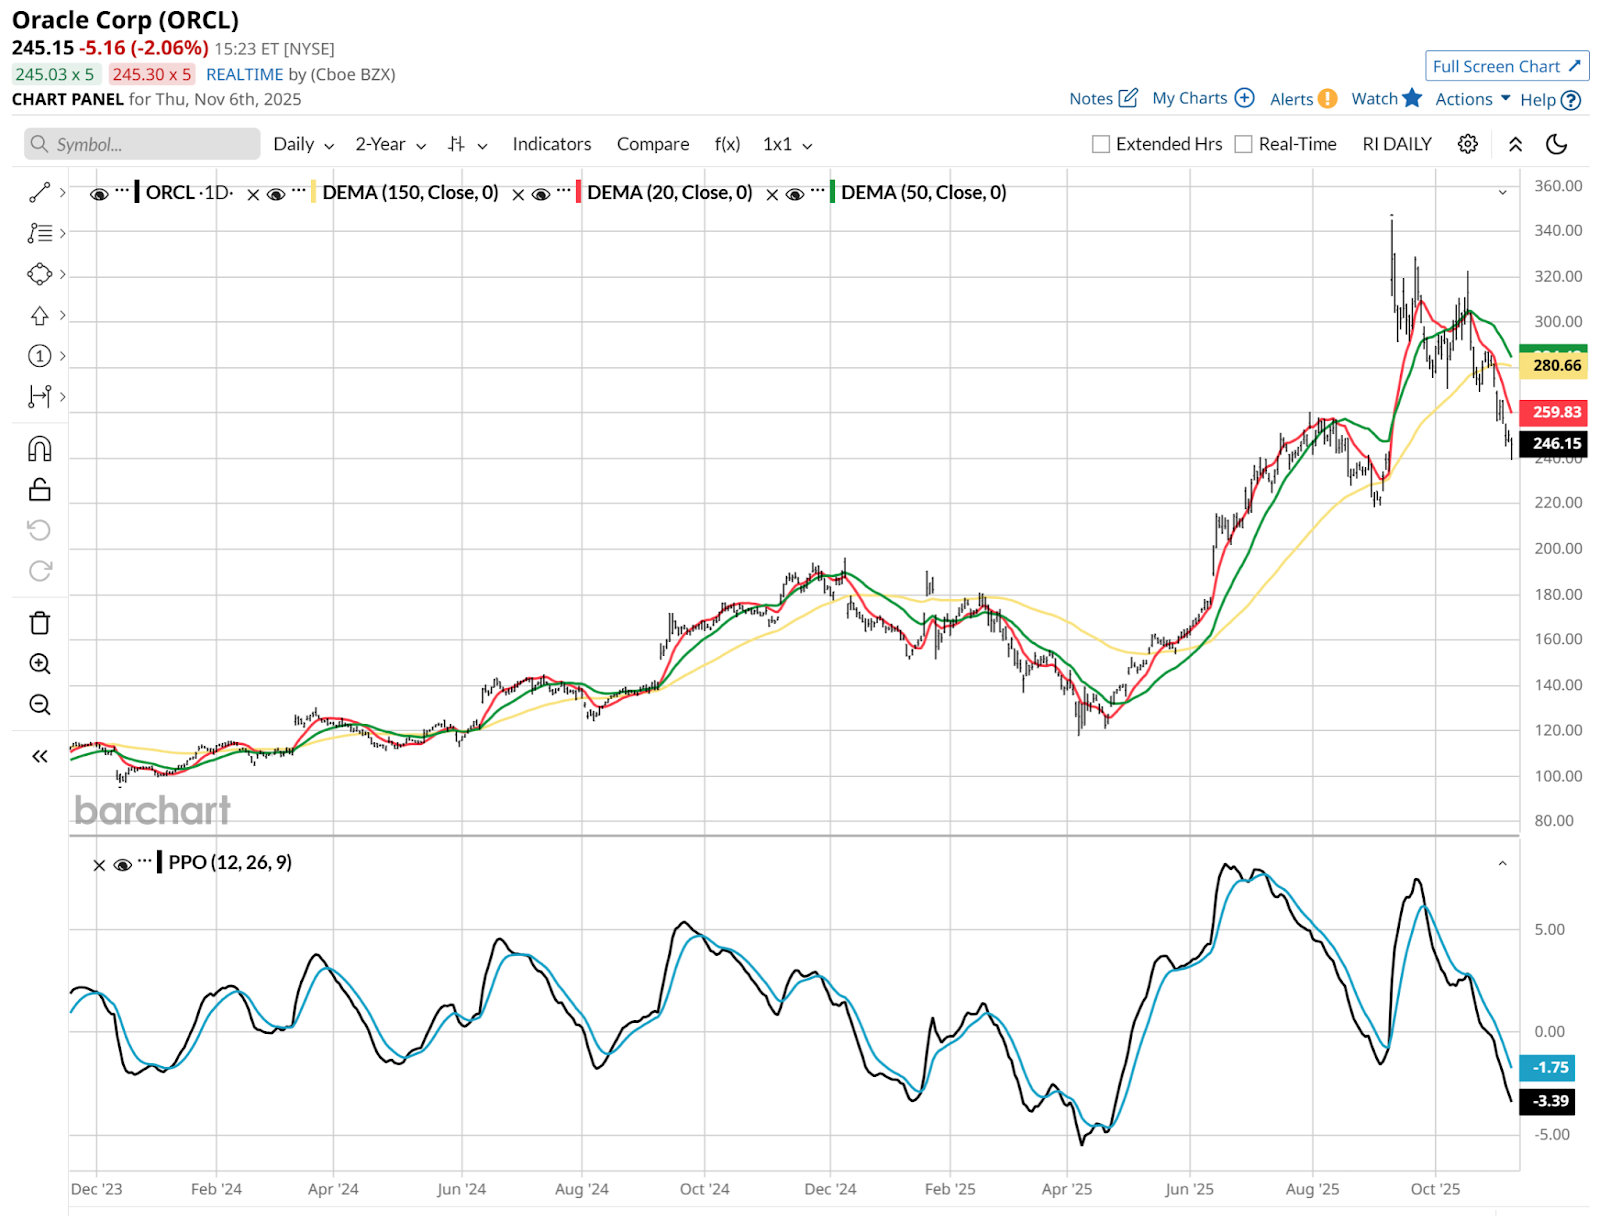
Next, there’s Oracle (ORCL). The company doubled in terms of CEOs earlier this year, replacing Safra Catz with co-CEOs Clay Magouryk and Mike Sicilia. From June 10 through Sept. 10, ORCL doubled in price as well, peaking around $340 a share. That included a single-day gain of more than 30% to cap off that 3-month run. The market pumped up the stock after it routed analyst expectations and made an aggressive forecast regarding its “Oracle Cloud Infrastructure” (OCI) AI service.
And Advanced Micro Devices (AMD) made a big deal with OpenAI, causing the market to make a big deal about AMD’s stock. It rallied more than 23% on Oct. 6. Then just 9 calendar days later, ORCL announced it would use 50,000 AMD chips by the end of next year, which took both stocks up solidly again. A similar arrangement between AMD and International Business Machines (IBM) added up to another big gain on a big deal.
Three stocks, three giant moves. But now, three very risky looking charts.
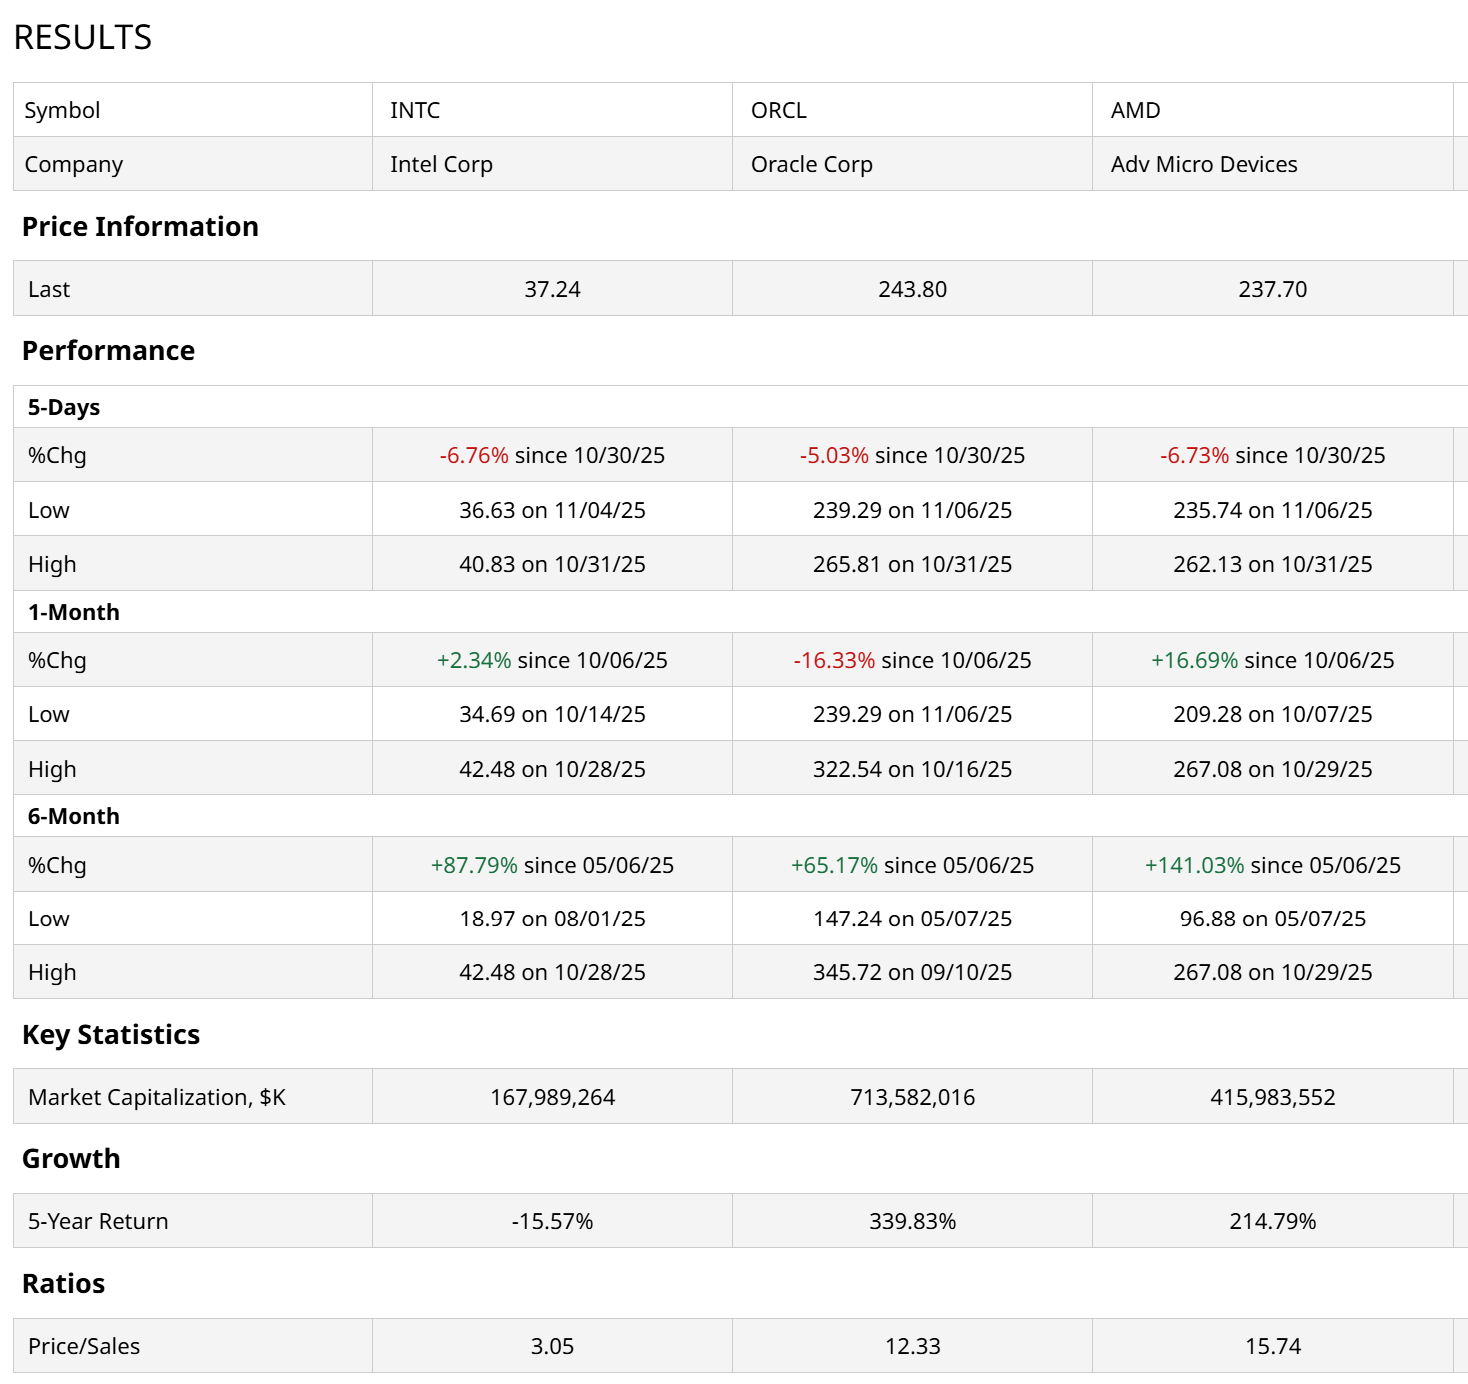
They’ve all done very well this year, particularly since the April lows. Their 6-month returns average 98%. Where I come from, that’s considered pretty good! They’ve all had recent setbacks, too. That 5-day return does not include the Thursday drubbing these three took, along with the broader market.
So, now what? If you own them, you may be wondering whether to reduce your position or hedge with options or an inverse ETF. If you don’t own them and see what I see in the charts, you may be thinking as I do with any bearish-leaning picture I find: “Can I make money on its decline?”
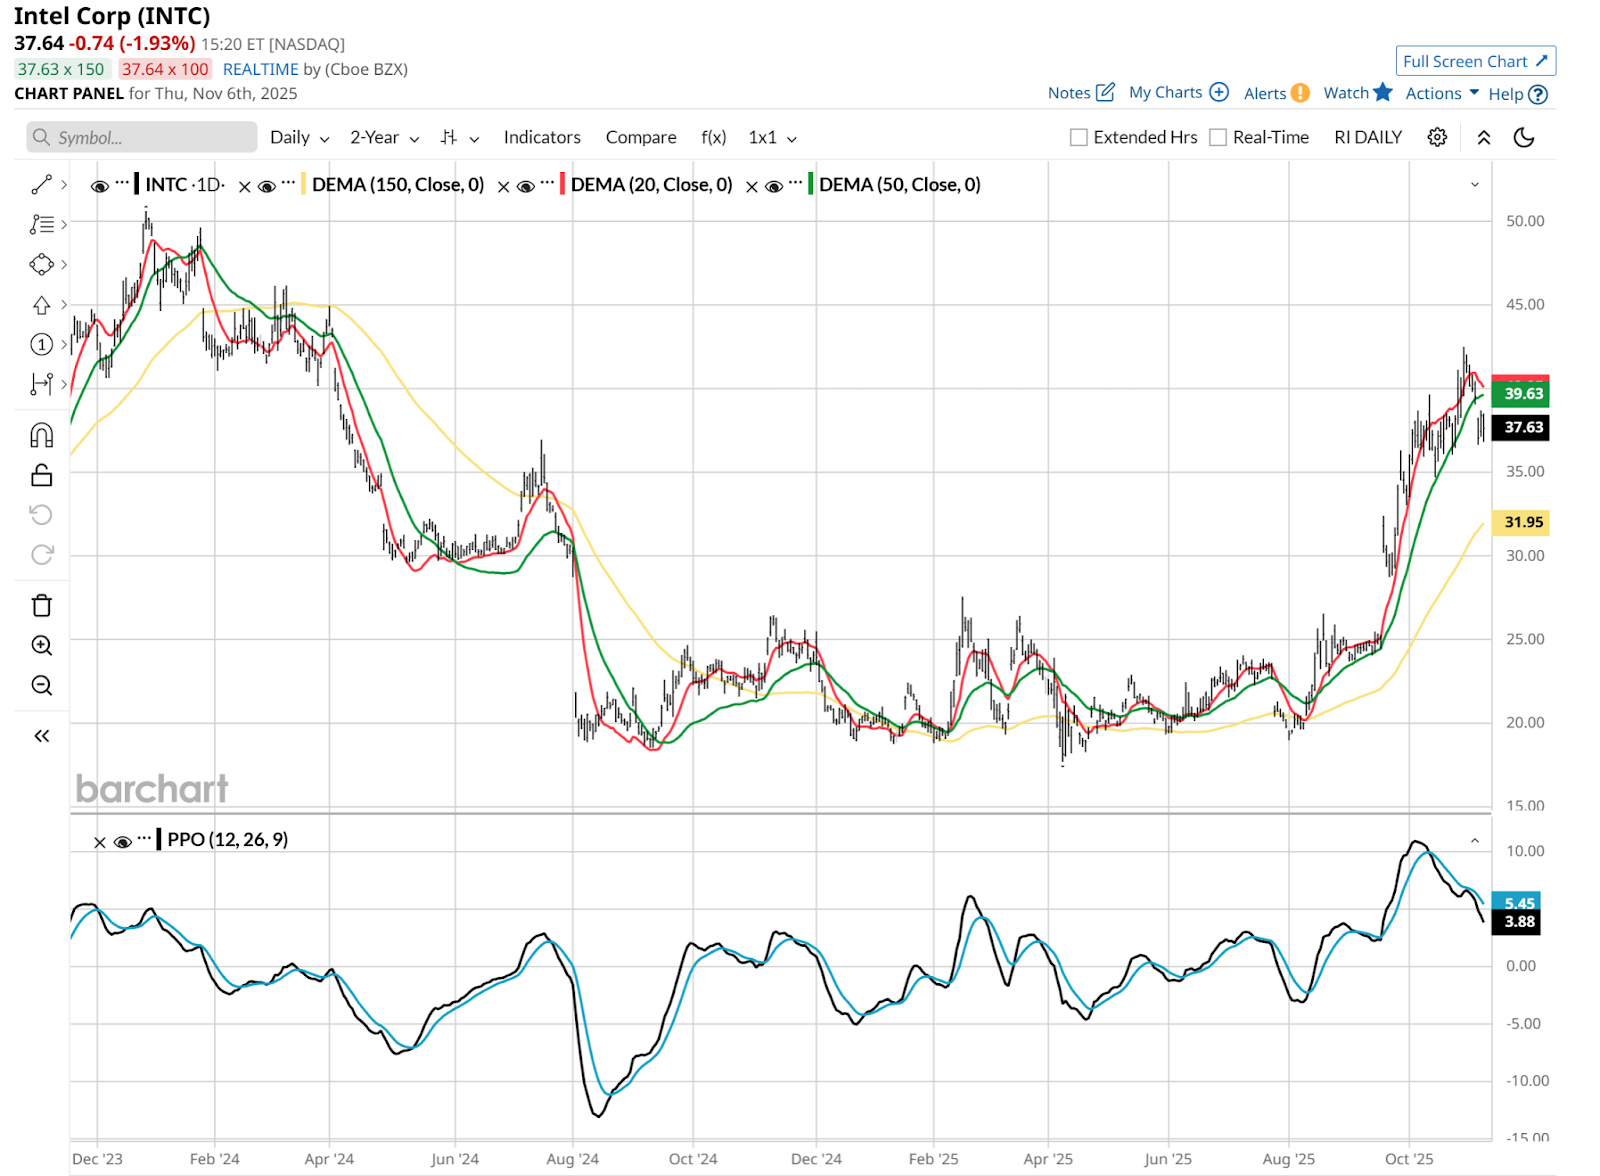
INTC looks like it could really be a hot mess. That should be no surprise after doubling since August. When a micro-cap stock does that, we don’t think twice about it. But this is still a major tech stock.
But now, it's rolling over. There’s still time for that Percentage Price Oscillator (PPO) indicator to stop falling before it crosses into negative territory, signalling lost momentum on a larger scale. And the 20-day moving average has turned negative. If the 50-day joins it, that’s the next level of concern to me. This is not magic. It’s an analysis of buying and selling pressure. When the latter is persistent in overwhelming the former, it does not matter what potential future revenue years from now might possibly be.
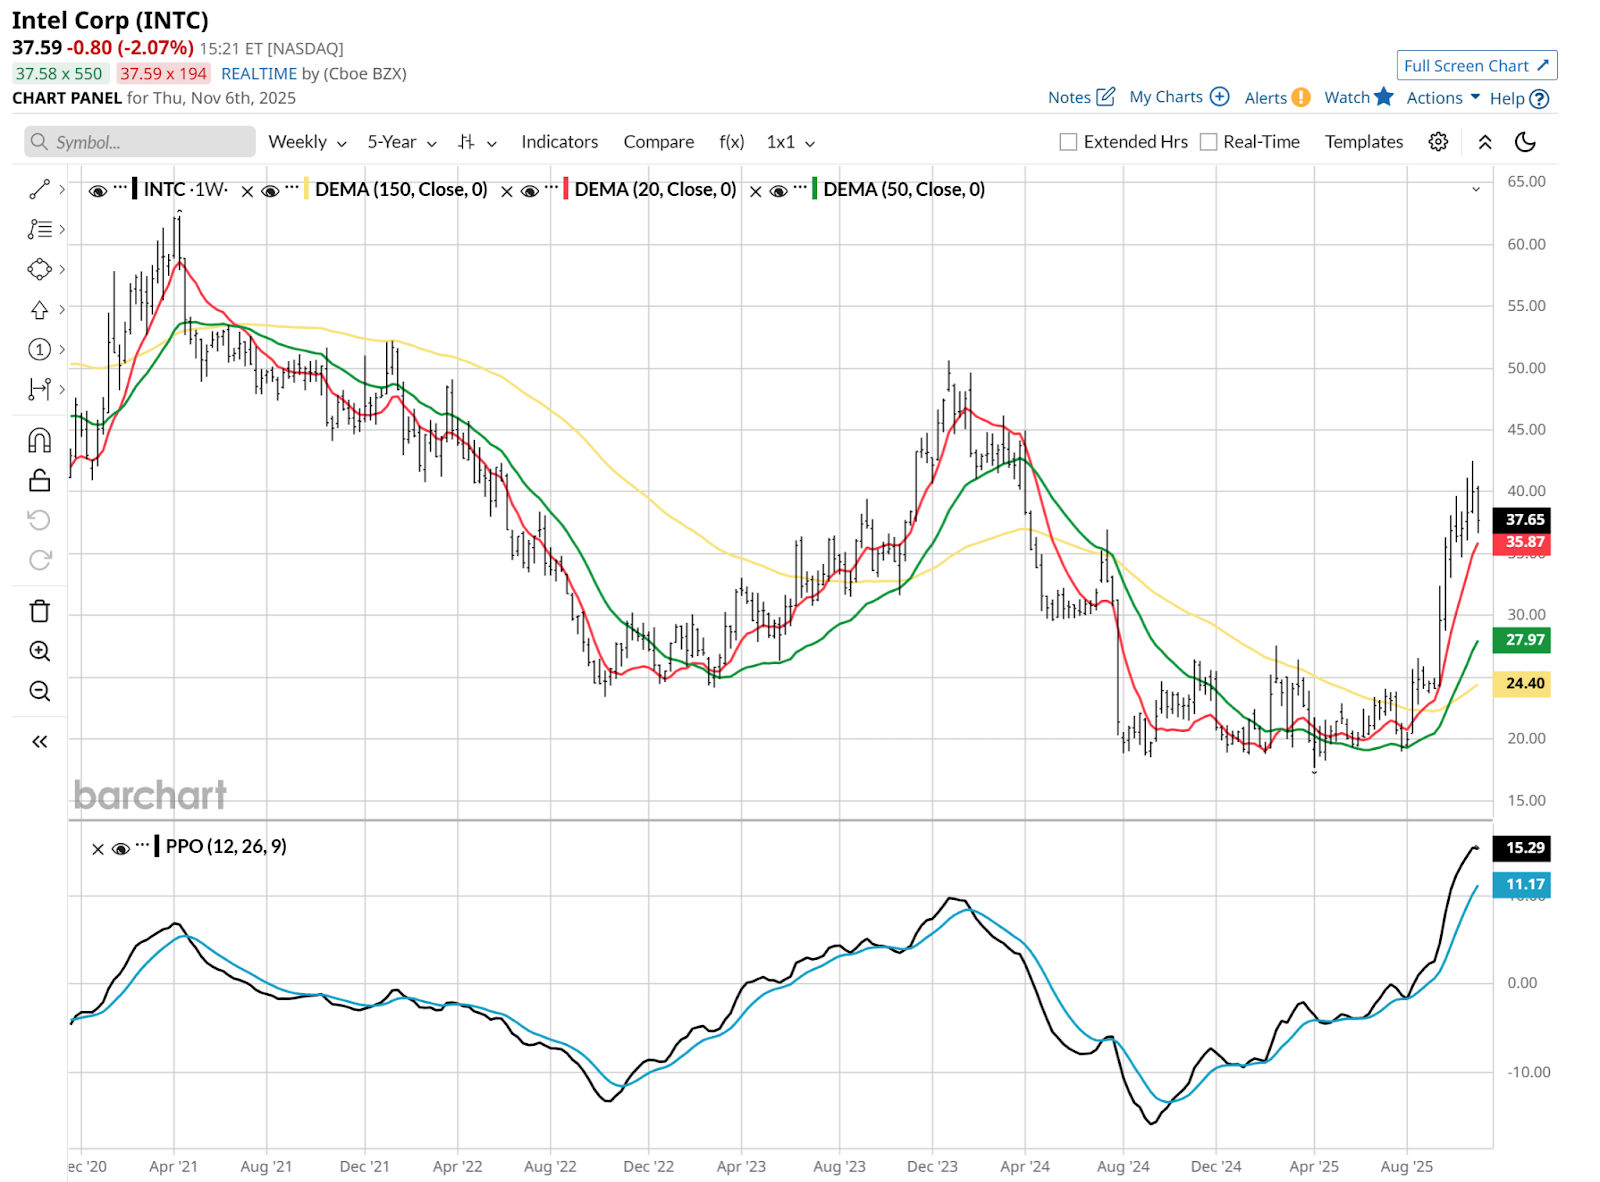
The weekly looks like it is headed toward the same reckoning. Also, not drawn on the chart, you can look at those three price tops since April 2021, and with your mind’s eye, draw a line connecting them. That translates to a higher risk scenario here.
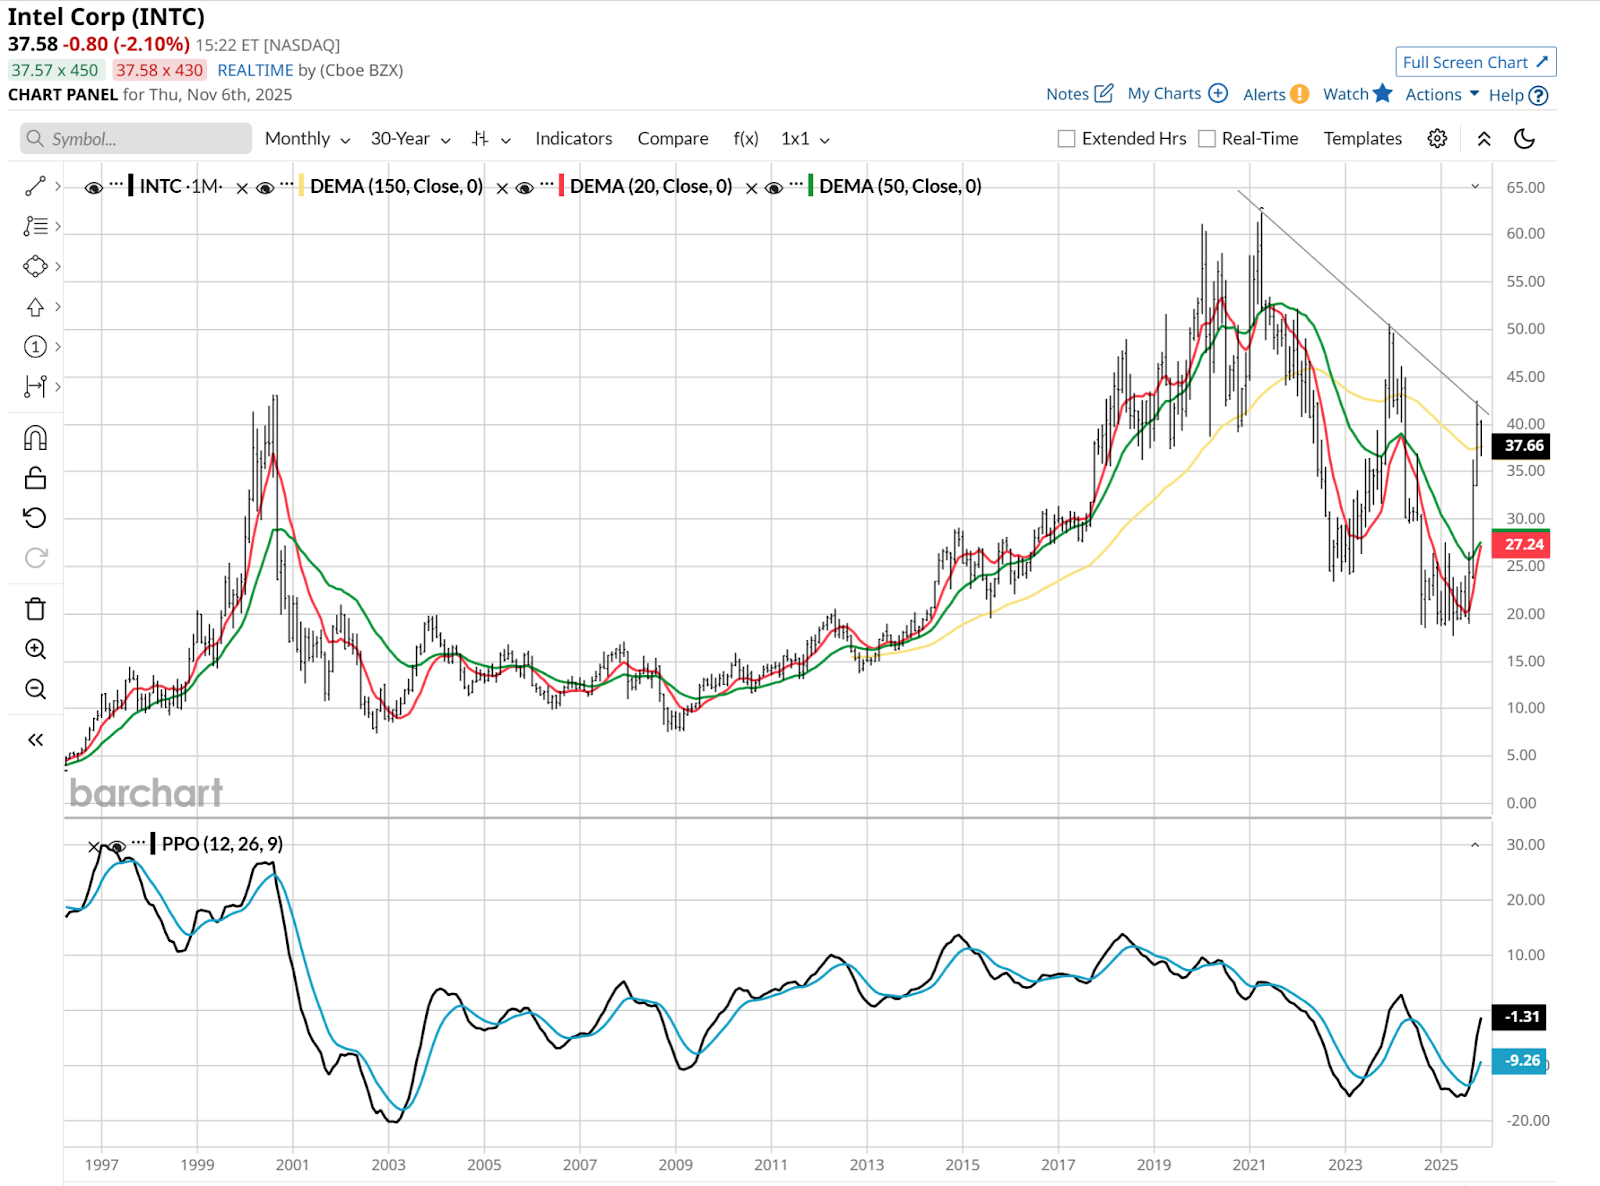
I did draw it on the monthly chart. This is just not a good look. That means INTC needs to bust out (higher) between now and year-end, or the picture will worsen further.
ORCL is, in my view, a classic case of “sell the news.” I’ve noticed that while the stock was a headline-grabber for a couple of weeks, it has slipped to the back pages. I guess I expected to see it front and center after a 30%, $100-per-share decline since late September.
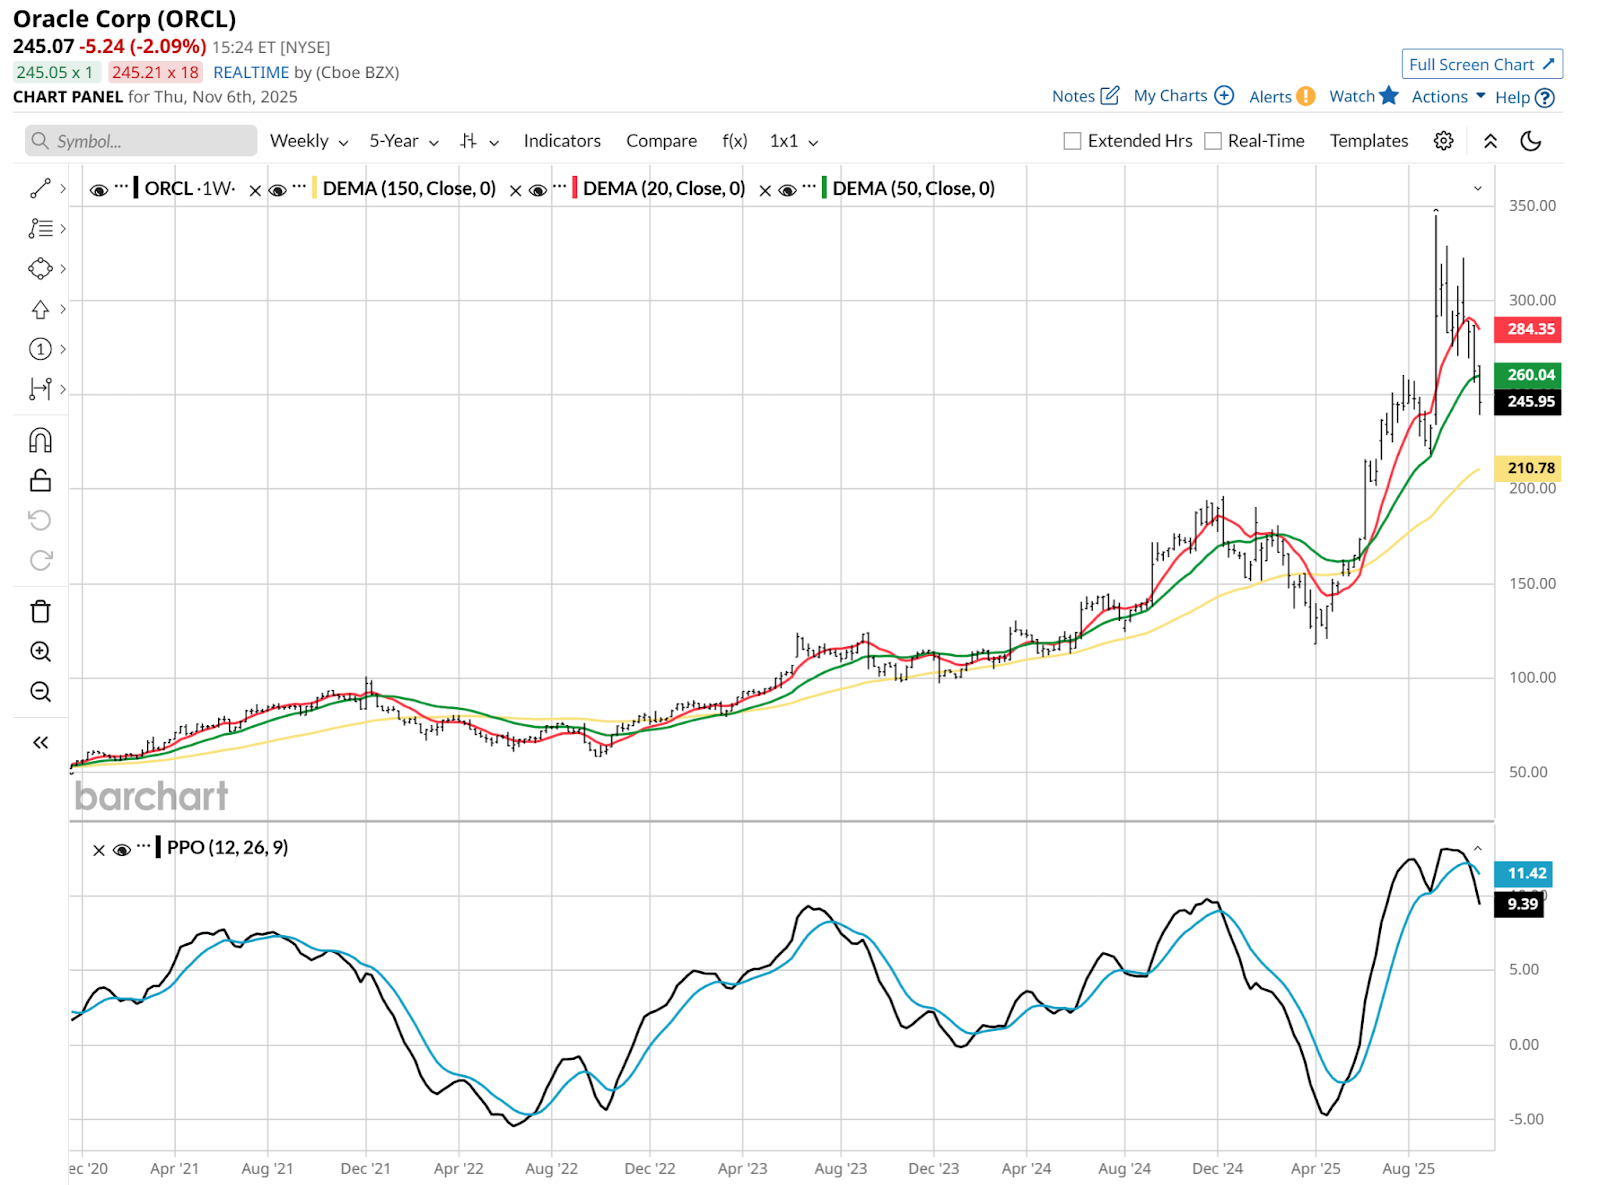
Beware of markets that celebrate the winners, then ignore those same stocks when they give a lot of it back. And with ORCL’s weekly below looking even worse than the daily above, I see it as a “sell the rallies” situation for traders here.
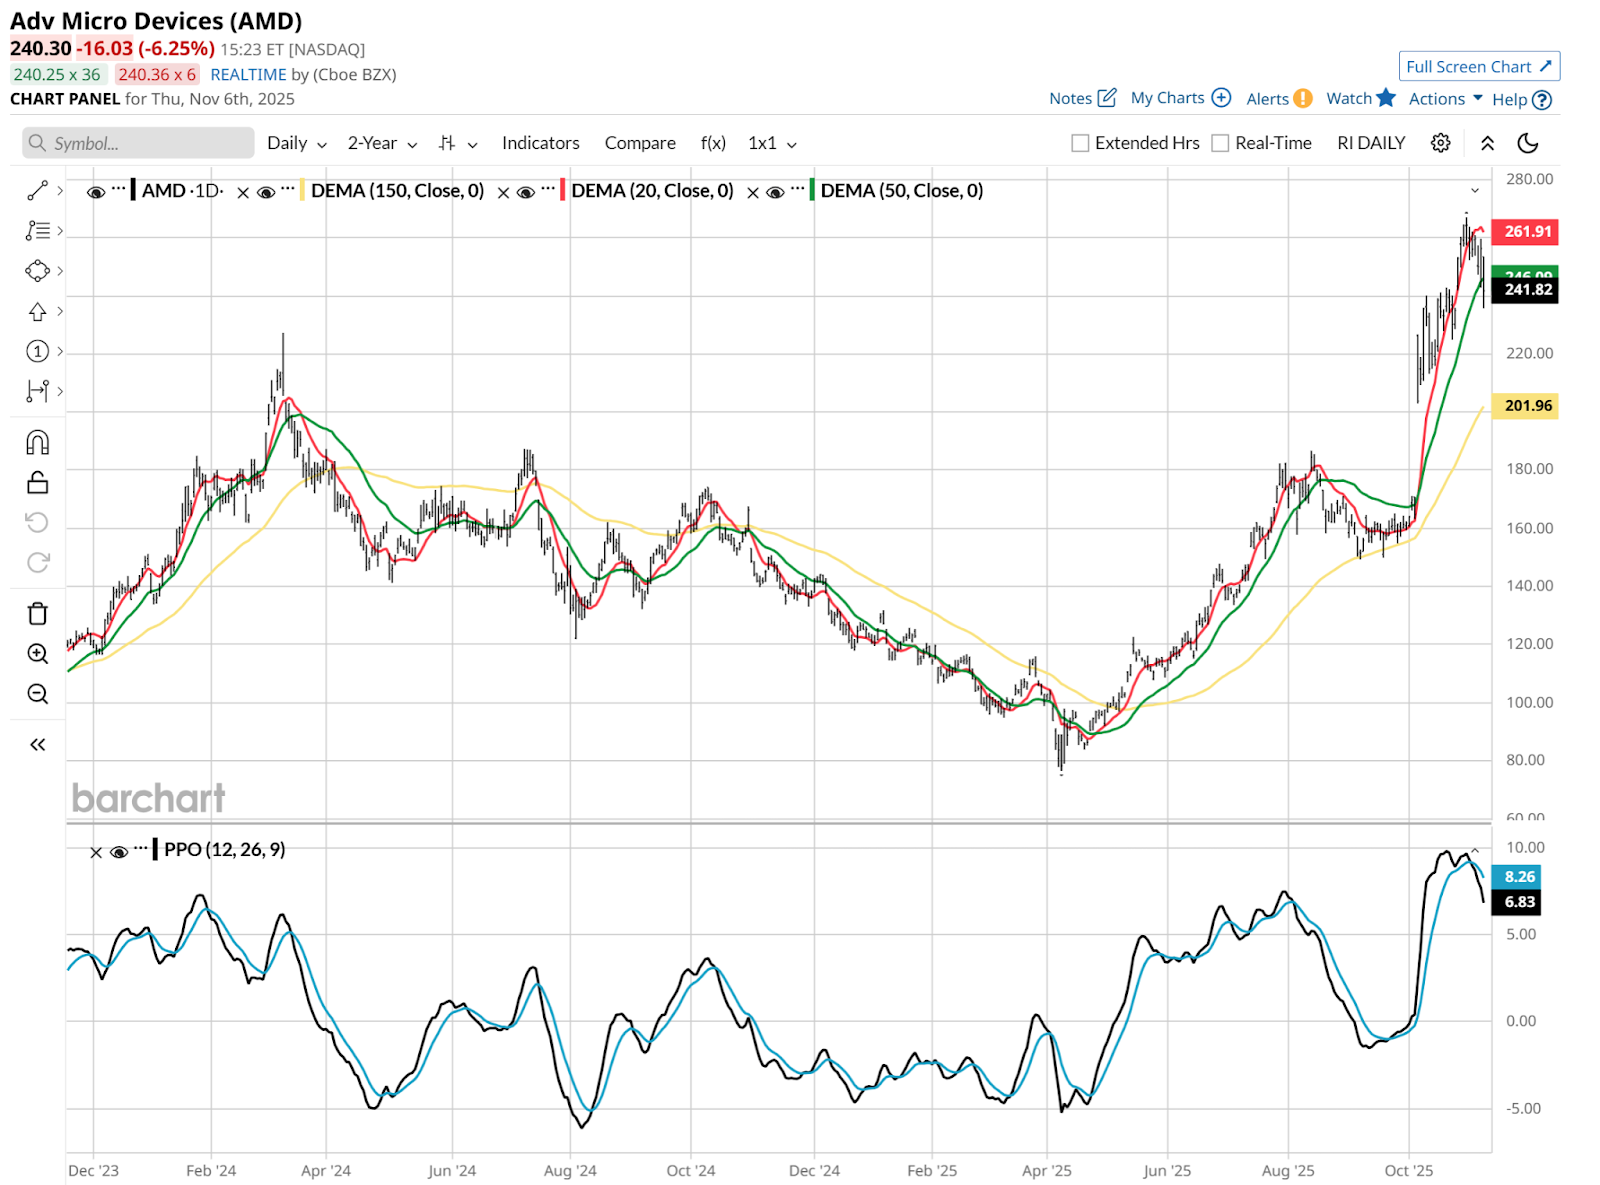
Finally, AMD is as vulnerable as any tech stock. Or other stock for that matter. It rallied on a lot of assumptions and announcements, and less about sustained profits and revenue from now forward. That doesn’t mean it won’t deliver, just that its expectations are extraordinarily high.
And the charts show it. The daily appears to be “peak optimism.” But more to the point, AMD is likely no better or worse than the broad tech and AI trade for a while. When markets get this extreme, they tend to be treated with a single brush.
So that’s three well-known tech stocks, which are all great to look at. In the rear-view mirror. This is an ideal time to take account of what just happened, and not assume that the past is prologue.
On the date of publication, Rob Isbitts did not have (either directly or indirectly) positions in any of the securities mentioned in this article. All information and data in this article is solely for informational purposes. For more information please view the Barchart Disclosure Policy here.
More news from Barchart
- Nvidia Stock 2026 Prediction: Can NVDA’s Gravity-Defying Rally Continue?
- These 3 Tech Stocks Have Been Red-Hot in 2025 but Their Charts Are Screaming ‘Danger’
- Stock Index Futures Slip as Valuation and Economic Concerns Persist, U.S. Confidence Data on Tap
- Verizon Is Getting an Amazon Data Center Boost. Should You Buy the High-Yield Dividend Stock Here?