

Rigid packaging solutions manufacturer Silgan Holdings (NYSE:SLGN) reported Q2 CY2025 results topping the market’s revenue expectations, with sales up 11.4% year on year to $1.54 billion. Its non-GAAP profit of $1.01 per share was 2.1% below analysts’ consensus estimates.
Is now the time to buy Silgan Holdings? Find out by accessing our full research report, it’s free.
Silgan Holdings (SLGN) Q2 CY2025 Highlights:
- Revenue: $1.54 billion vs analyst estimates of $1.53 billion (11.4% year-on-year growth, 0.5% beat)
- Adjusted EPS: $1.01 vs analyst expectations of $1.03 (2.1% miss)
- Adjusted EBITDA: $239 million vs analyst estimates of $260.8 million (15.5% margin, 8.4% miss)
- Management lowered its full-year Adjusted EPS guidance to $3.95 at the midpoint, a 3.7% decrease
- Operating Margin: 10.9%, in line with the same quarter last year
- Free Cash Flow was -$241.7 million compared to -$40.28 million in the same quarter last year
- Market Capitalization: $5.97 billion
"Our businesses continued to execute in the second quarter and delivered significant adjusted EPS growth of 15%, driven by increased organic volumes in our key product categories, strong contributions from the successful integration of the Weener acquisition and continued best-in-class operating performance. Once again, our diverse portfolio, the strength of our teams, our focus on innovation and our disciplined value creation strategy continue to drive our performance and the long-term success of the Company," said Adam Greenlee, President and CEO.
Company Overview
Established in 1987, Silgan Holdings (NYSE:SLGN) is a supplier of rigid packaging for consumer goods products, specializing in metal containers, closures, and plastic packaging.
Revenue Growth
Reviewing a company’s long-term sales performance reveals insights into its quality. Any business can put up a good quarter or two, but the best consistently grow over the long haul. Over the last five years, Silgan Holdings grew its sales at a mediocre 6.1% compounded annual growth rate. This was below our standard for the industrials sector and is a poor baseline for our analysis.
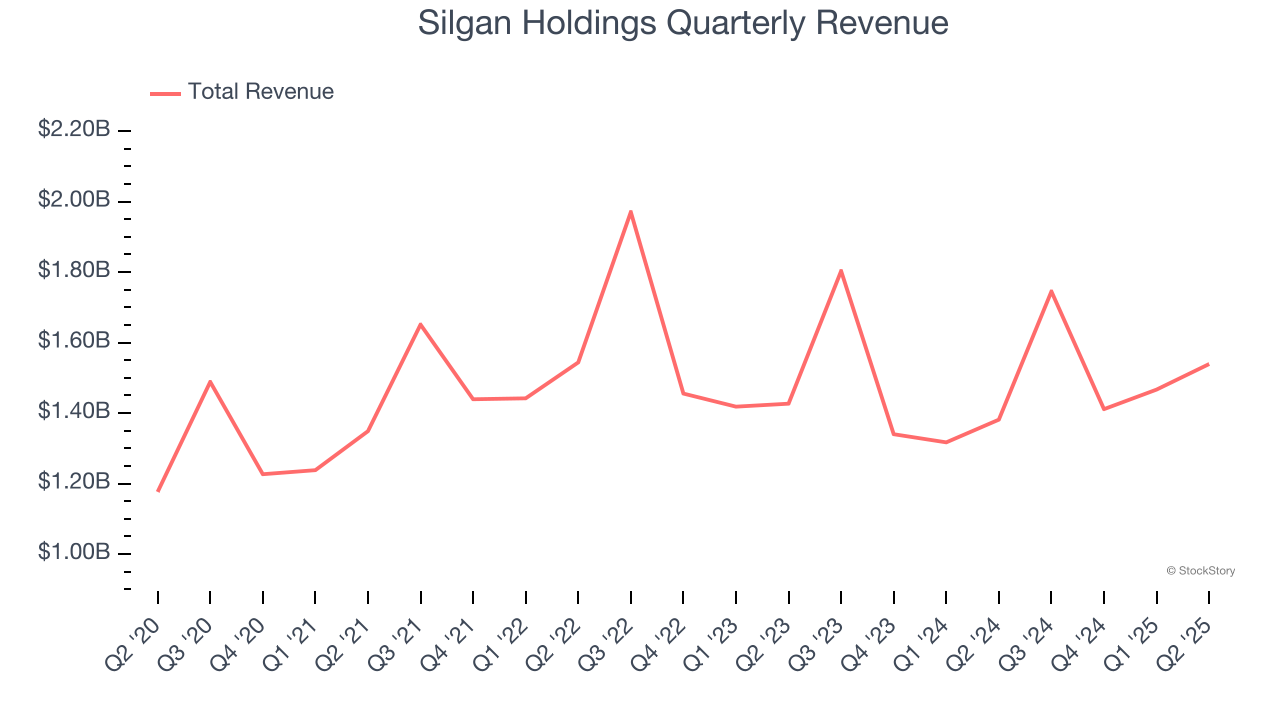
We at StockStory place the most emphasis on long-term growth, but within industrials, a half-decade historical view may miss cycles, industry trends, or a company capitalizing on catalysts such as a new contract win or a successful product line. Silgan Holdings’s recent performance shows its demand has slowed as its revenue was flat over the last two years. We also note many other Industrial Packaging businesses have faced declining sales because of cyclical headwinds. While Silgan Holdings’s growth wasn’t the best, it did do better than its peers. 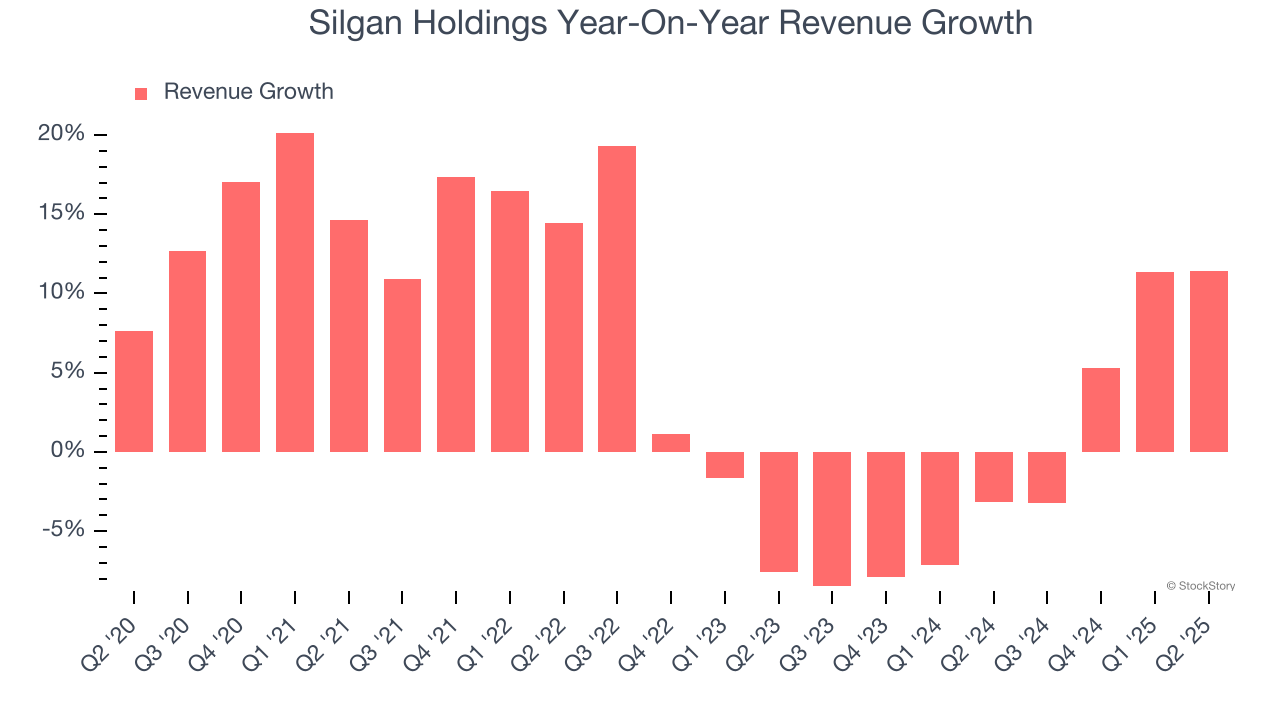
This quarter, Silgan Holdings reported year-on-year revenue growth of 11.4%, and its $1.54 billion of revenue exceeded Wall Street’s estimates by 0.5%.
Looking ahead, sell-side analysts expect revenue to grow 5.9% over the next 12 months. While this projection implies its newer products and services will spur better top-line performance, it is still below average for the sector.
Unless you’ve been living under a rock, it should be obvious by now that generative AI is going to have a huge impact on how large corporations do business. While Nvidia and AMD are trading close to all-time highs, we prefer a lesser-known (but still profitable) stock benefiting from the rise of AI. Click here to access our free report one of our favorites growth stories.
Operating Margin
Silgan Holdings has done a decent job managing its cost base over the last five years. The company has produced an average operating margin of 9.7%, higher than the broader industrials sector.
Analyzing the trend in its profitability, Silgan Holdings’s operating margin decreased by 1.5 percentage points over the last five years. Many Industrial Packaging companies also saw their margins fall (along with revenue, as mentioned above) because the cycle turned in the wrong direction. We hope Silgan Holdings can emerge from this a stronger company, as the silver lining of a downturn is that market share can be won and efficiencies found.
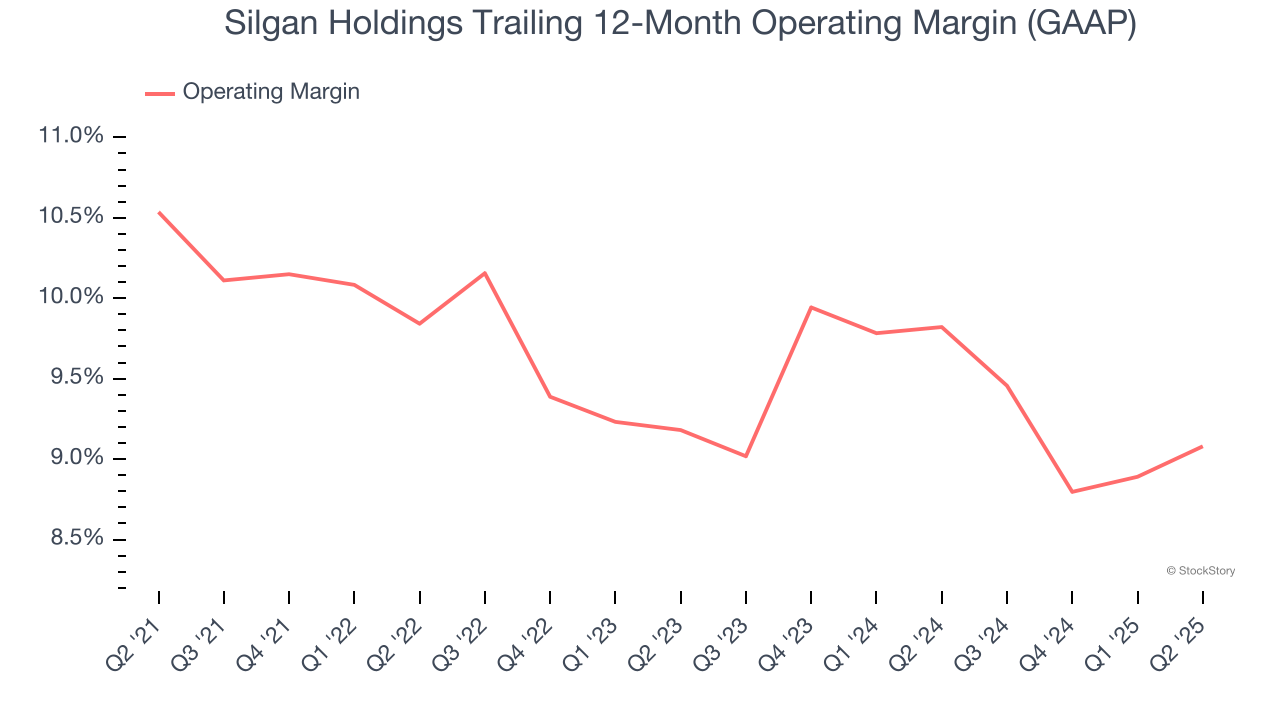
In Q2, Silgan Holdings generated an operating margin profit margin of 10.9%, in line with the same quarter last year. This indicates the company’s cost structure has recently been stable.
Earnings Per Share
We track the long-term change in earnings per share (EPS) for the same reason as long-term revenue growth. Compared to revenue, however, EPS highlights whether a company’s growth is profitable.
Silgan Holdings’s EPS grew at a decent 8.7% compounded annual growth rate over the last five years, higher than its 6.1% annualized revenue growth. However, this alone doesn’t tell us much about its business quality because its operating margin didn’t improve.
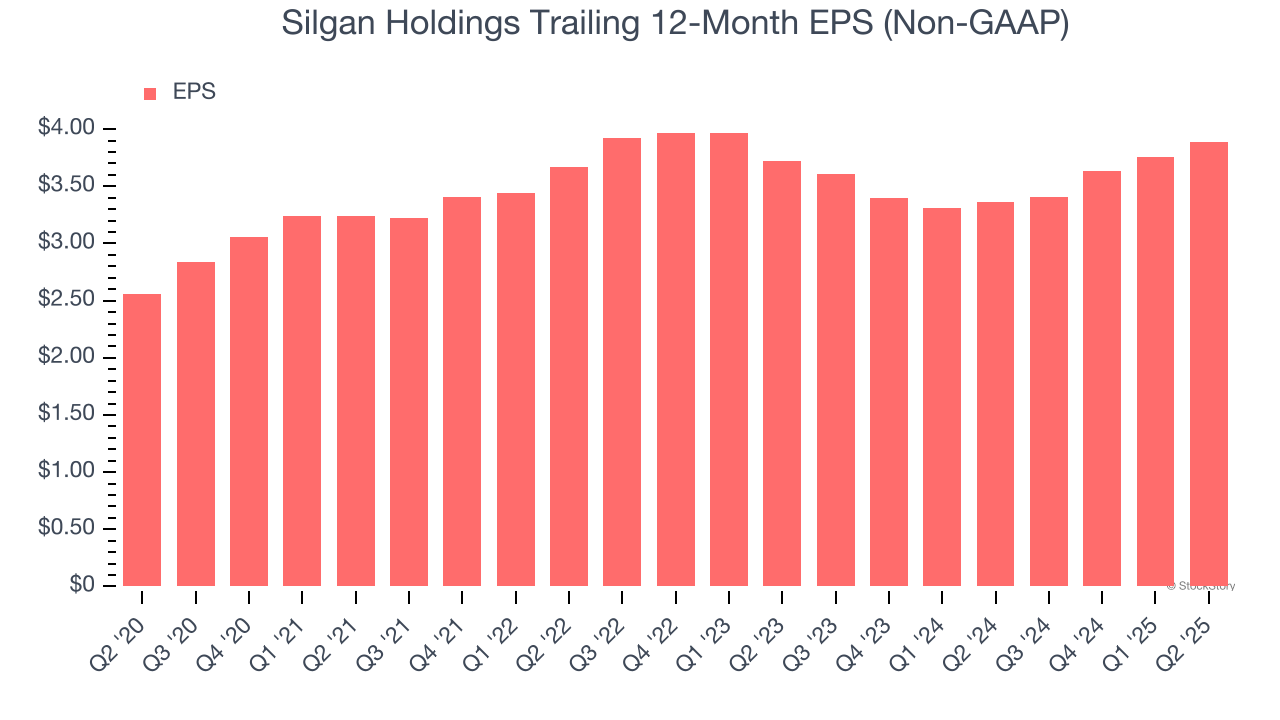
We can take a deeper look into Silgan Holdings’s earnings to better understand the drivers of its performance. A five-year view shows that Silgan Holdings has repurchased its stock, shrinking its share count by 3.6%. This tells us its EPS outperformed its revenue not because of increased operational efficiency but financial engineering, as buybacks boost per share earnings. 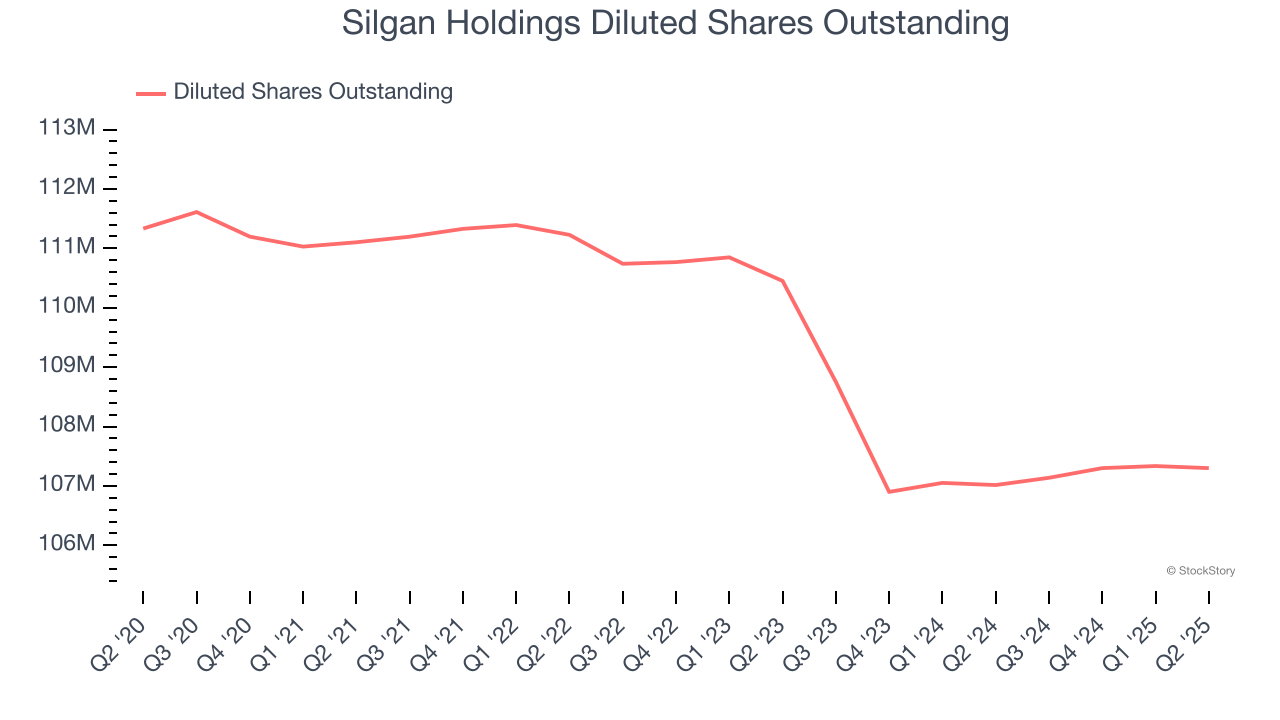
Like with revenue, we analyze EPS over a more recent period because it can provide insight into an emerging theme or development for the business.
For Silgan Holdings, its two-year annual EPS growth of 2.3% was lower than its five-year trend. We hope its growth can accelerate in the future.
In Q2, Silgan Holdings reported EPS at $1.01, up from $0.88 in the same quarter last year. Despite growing year on year, this print missed analysts’ estimates, but we care more about long-term EPS growth than short-term movements. Over the next 12 months, Wall Street expects Silgan Holdings’s full-year EPS of $3.89 to grow 9.2%.
Key Takeaways from Silgan Holdings’s Q2 Results
It was good to see Silgan Holdings narrowly top analysts’ revenue expectations this quarter. On the other hand, its full-year EPS guidance missed and its EBITDA fell short of Wall Street’s estimates. Overall, this was a weaker quarter. The stock traded down 1.6% to $54.89 immediately after reporting.
Silgan Holdings didn’t show it’s best hand this quarter, but does that create an opportunity to buy the stock right now? When making that decision, it’s important to consider its valuation, business qualities, as well as what has happened in the latest quarter. We cover that in our actionable full research report which you can read here, it’s free.