

Industrial component provider Timken (NYSE:TKR) announced better-than-expected revenue in Q2 CY2025, but sales were flat year on year at $1.17 billion. Its non-GAAP profit of $1.42 per share was 4.3% above analysts’ consensus estimates.
Is now the time to buy Timken? Find out by accessing our full research report, it’s free.
Timken (TKR) Q2 CY2025 Highlights:
- Revenue: $1.17 billion vs analyst estimates of $1.15 billion (flat year on year, 2.3% beat)
- Adjusted EPS: $1.42 vs analyst estimates of $1.36 (4.3% beat)
- Adjusted EBITDA: $208.2 million vs analyst estimates of $201.3 million (17.7% margin, 3.4% beat)
- Management lowered its full-year Adjusted EPS guidance to $5.25 at the midpoint, a 1.9% decrease
- Operating Margin: 12.6%, down from 14.1% in the same quarter last year
- Free Cash Flow Margin: 6.7%, similar to the same quarter last year
- Organic Revenue fell 2.5% year on year (-7.7% in the same quarter last year)
- Market Capitalization: $5.67 billion
"Timken delivered second-quarter results that were largely in line with expectations, as our team continues to manage through this period of elevated uncertainty," said Richard G. Kyle, president and chief executive officer.
Company Overview
Established after the founder noticed the difficulty freight wagons had making sharp turns, Timken (NYSE:TKR) is a provider of industrial parts used across various sectors.
Revenue Growth
A company’s long-term sales performance is one signal of its overall quality. Even a bad business can shine for one or two quarters, but a top-tier one grows for years. Over the last five years, Timken grew its sales at a tepid 5% compounded annual growth rate. This was below our standard for the industrials sector and is a rough starting point for our analysis.
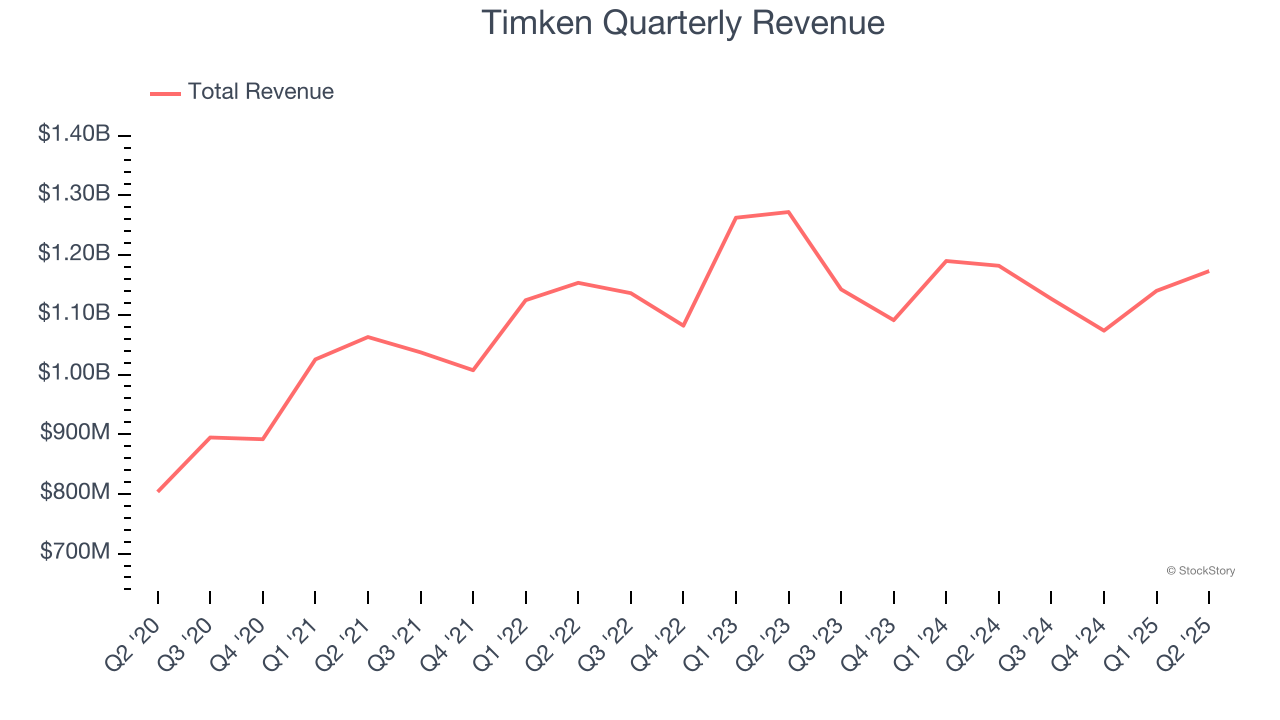
Long-term growth is the most important, but within industrials, a half-decade historical view may miss new industry trends or demand cycles. Timken’s performance shows it grew in the past but relinquished its gains over the last two years, as its revenue fell by 2.6% annually. 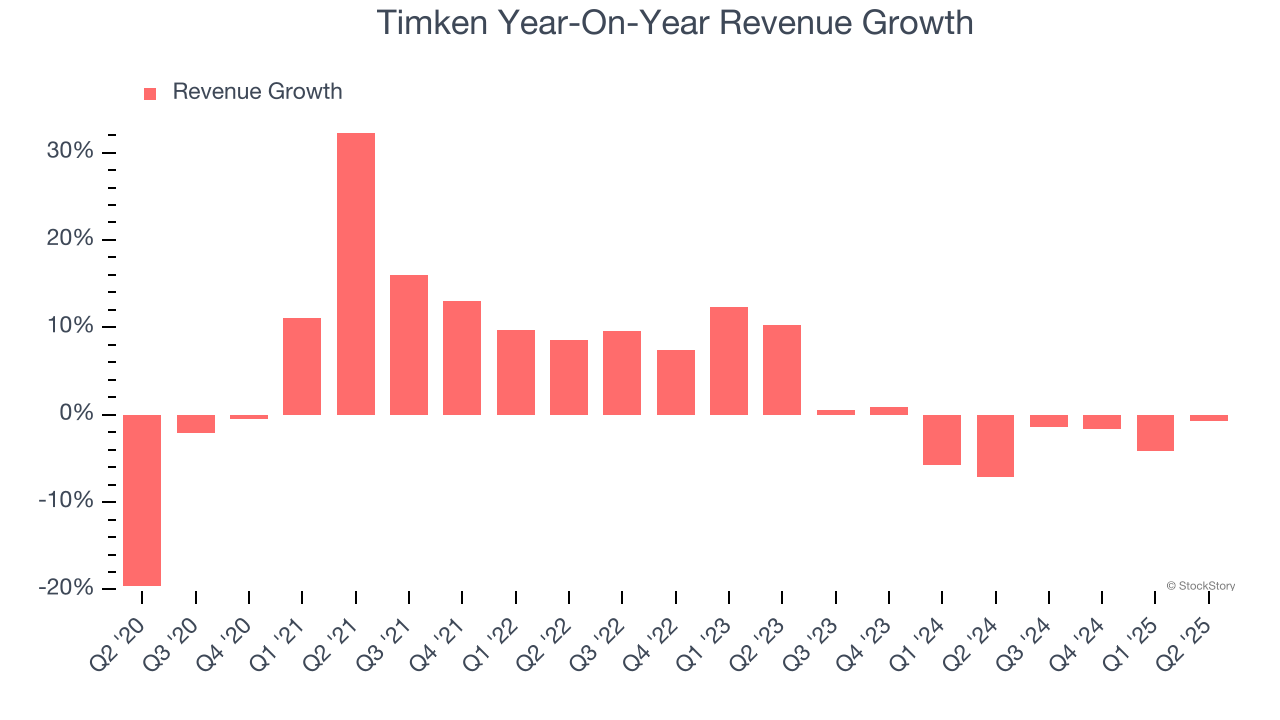
Timken also reports organic revenue, which strips out one-time events like acquisitions and currency fluctuations that don’t accurately reflect its fundamentals. Over the last two years, Timken’s organic revenue averaged 4.9% year-on-year declines. Because this number is lower than its normal revenue growth, we can see that some mixture of acquisitions and foreign exchange rates boosted its headline results. 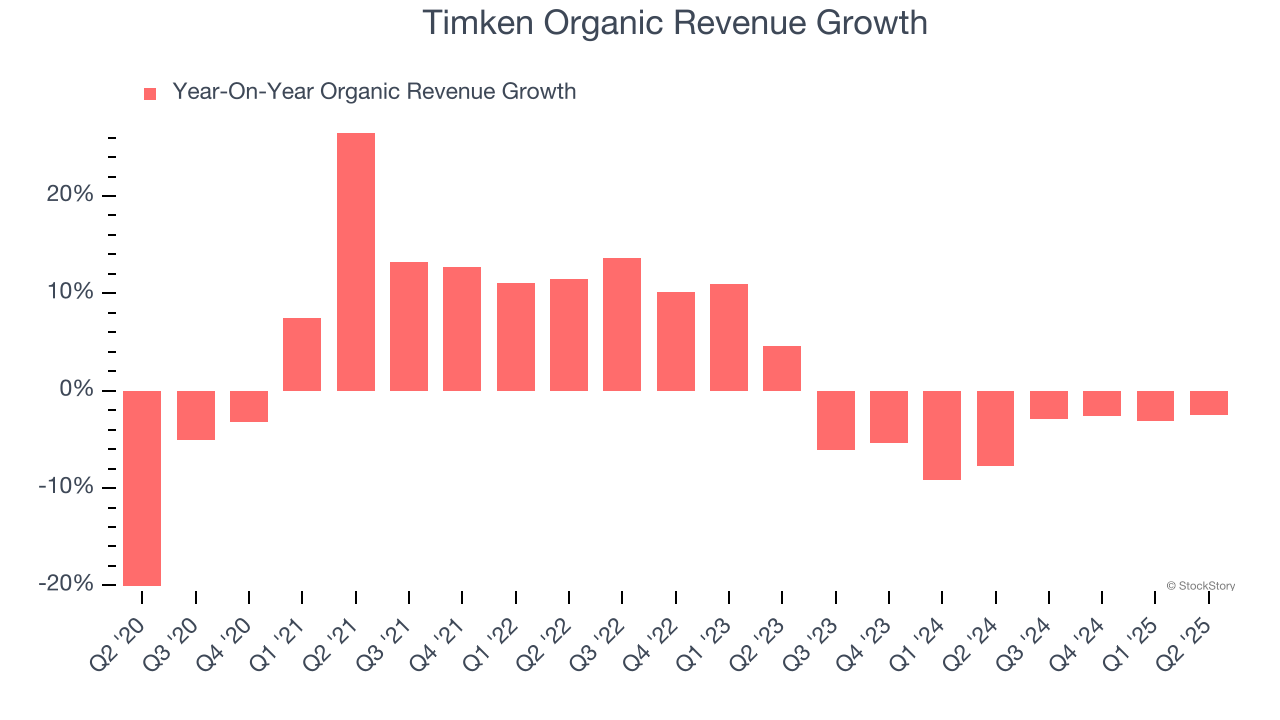
This quarter, Timken’s $1.17 billion of revenue was flat year on year but beat Wall Street’s estimates by 2.3%.
Looking ahead, sell-side analysts expect revenue to remain flat over the next 12 months. While this projection suggests its newer products and services will spur better top-line performance, it is still below the sector average.
Here at StockStory, we certainly understand the potential of thematic investing. Diverse winners from Microsoft (MSFT) to Alphabet (GOOG), Coca-Cola (KO) to Monster Beverage (MNST) could all have been identified as promising growth stories with a megatrend driving the growth. So, in that spirit, we’ve identified a relatively under-the-radar profitable growth stock benefiting from the rise of AI, available to you FREE via this link.
Operating Margin
Timken has been an efficient company over the last five years. It was one of the more profitable businesses in the industrials sector, boasting an average operating margin of 13.1%. This result was particularly impressive because of its low gross margin, which is mostly a factor of what it sells and takes huge shifts to move meaningfully. Companies have more control over their operating margins, and it’s a show of well-managed operations if they’re high when gross margins are low.
Analyzing the trend in its profitability, Timken’s operating margin decreased by 1.2 percentage points over the last five years. This raises questions about the company’s expense base because its revenue growth should have given it leverage on its fixed costs, resulting in better economies of scale and profitability.
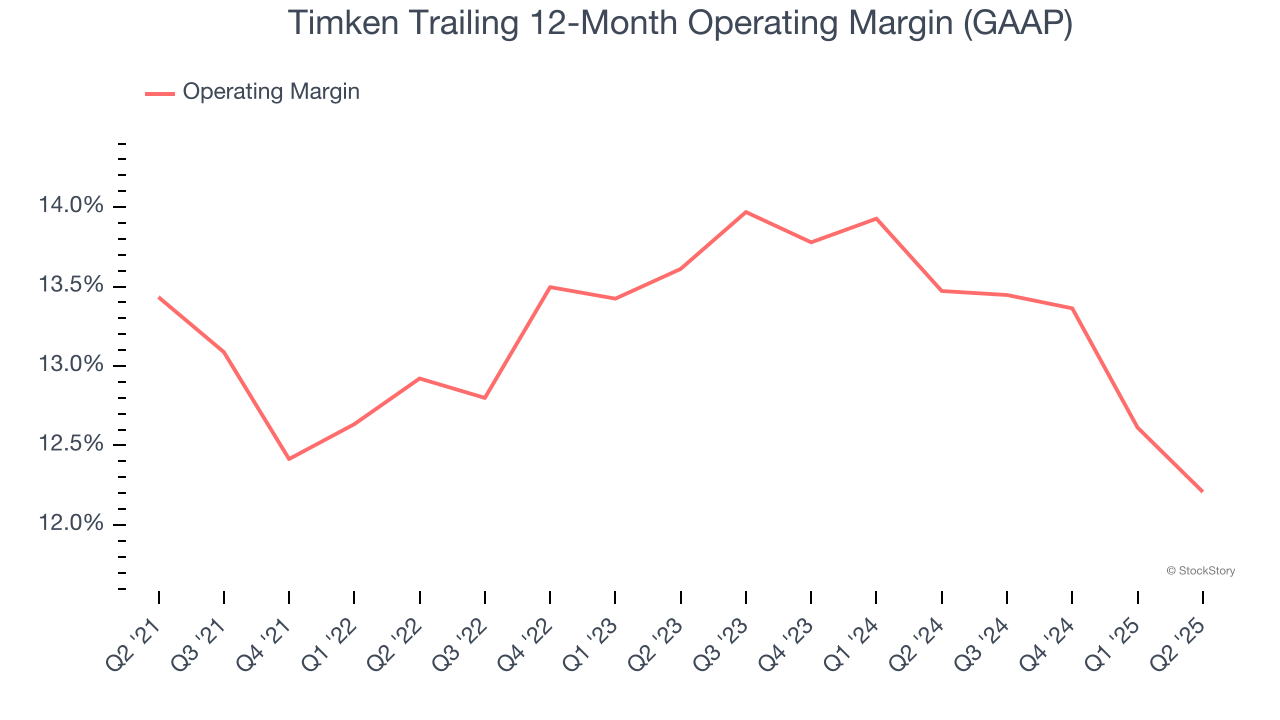
This quarter, Timken generated an operating margin profit margin of 12.6%, down 1.5 percentage points year on year. Since Timken’s operating margin decreased more than its gross margin, we can assume it was less efficient because expenses such as marketing, R&D, and administrative overhead increased.
Earnings Per Share
Revenue trends explain a company’s historical growth, but the long-term change in earnings per share (EPS) points to the profitability of that growth – for example, a company could inflate its sales through excessive spending on advertising and promotions.
Timken’s unimpressive 4.9% annual EPS growth over the last five years aligns with its revenue performance. This tells us it maintained its per-share profitability as it expanded.
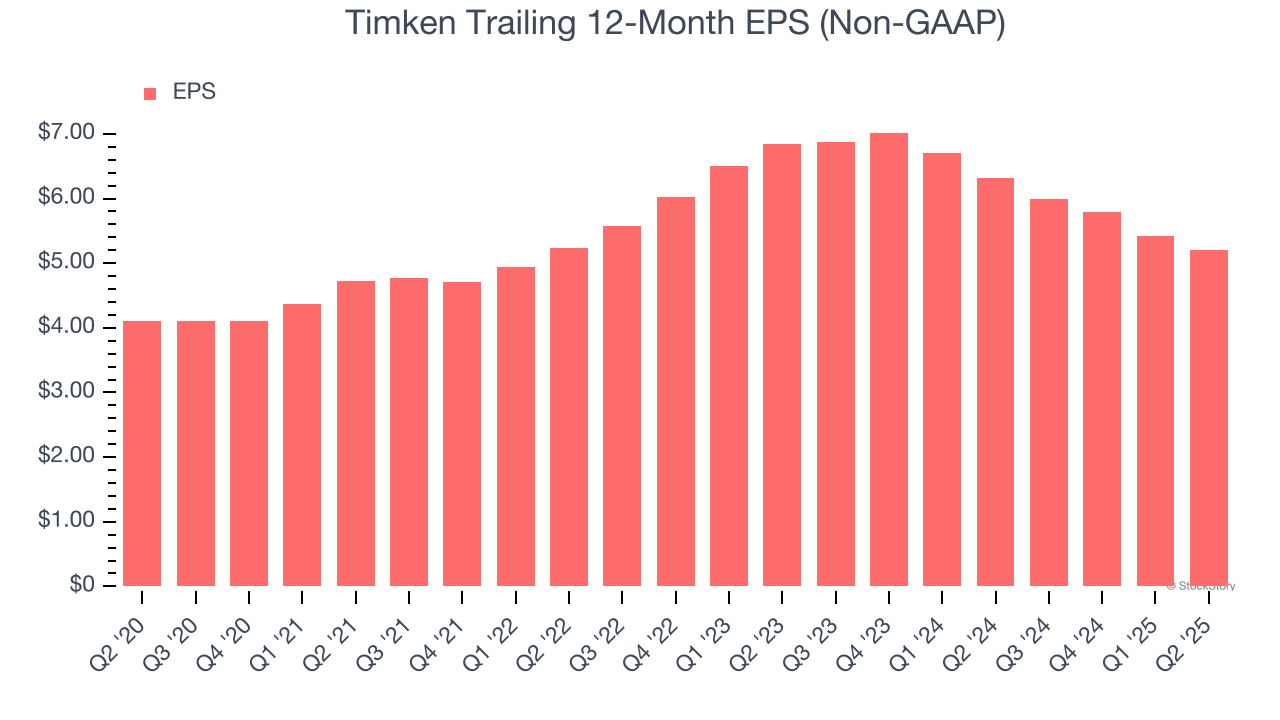
Like with revenue, we analyze EPS over a more recent period because it can provide insight into an emerging theme or development for the business.
Timken’s two-year annual EPS declines of 12.7% were bad and lower than its two-year revenue performance.
We can take a deeper look into Timken’s earnings to better understand the drivers of its performance. Timken’s operating margin has declined by 3.2 percentage points over the last two years. This was the most relevant factor (aside from the revenue impact) behind its lower earnings; interest expenses and taxes can also affect EPS but don’t tell us as much about a company’s fundamentals.
In Q2, Timken reported EPS at $1.42, down from $1.63 in the same quarter last year. Despite falling year on year, this print beat analysts’ estimates by 4.3%. Over the next 12 months, Wall Street expects Timken’s full-year EPS of $5.21 to grow 14.4%.
Key Takeaways from Timken’s Q2 Results
We enjoyed seeing Timken beat analysts’ revenue expectations this quarter. We were also happy its EBITDA outperformed Wall Street’s estimates. On the other hand, its full-year EPS guidance was lowered and missed. This weighed on shares, and the stock traded down 2.5% to $78.94 immediately following the results.
So do we think Timken is an attractive buy at the current price? What happened in the latest quarter matters, but not as much as longer-term business quality and valuation, when deciding whether to invest in this stock. We cover that in our actionable full research report which you can read here, it’s free.